IC Markets Home Sign in Web Trader Contact Us
IC Markets Social IC Markets Social

Information Hub for
Serious Traders

  • ABOUT US
  • OPEN LIVE ACCOUNT
  • OPEN DEMO ACCOUNT
  • TRADE NOW
  • VISIT OUR BLOG
IC Markets Social
  • ABOUT US
  • OPEN LIVE ACCOUNT
  • OPEN DEMO ACCOUNT
  • TRADE NOW
  • VISIT OUR BLOG
July 25, 2024North_American_Stocks_esIC Markets

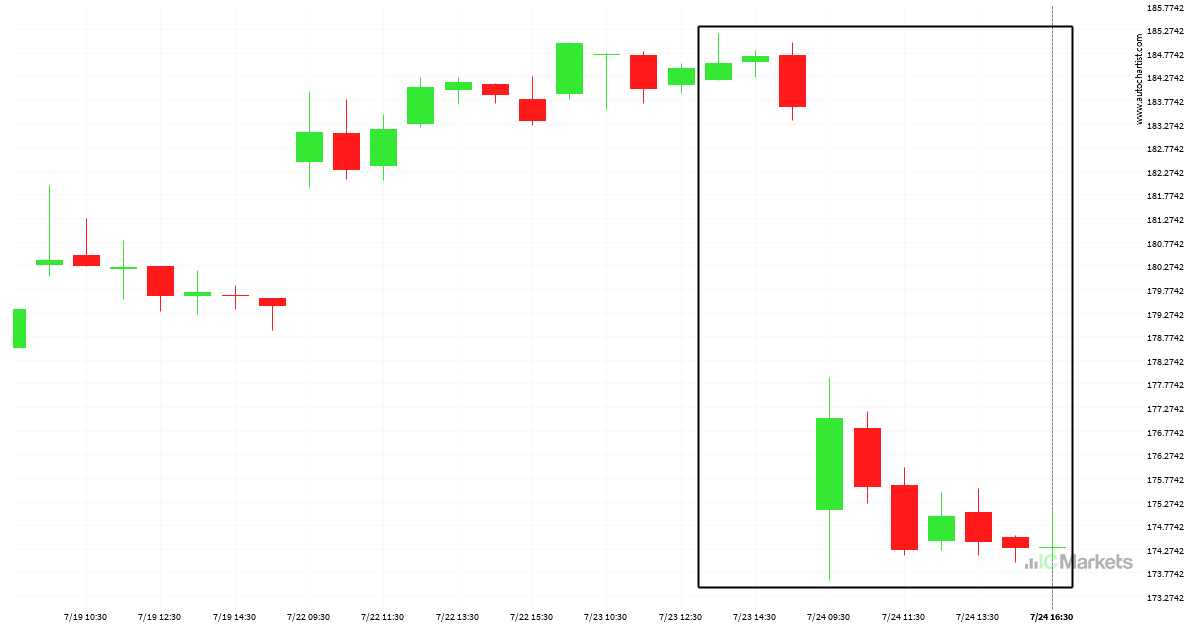
ALPHABET INC CLASS C se está moviendo, actúe ahora

ALPHABET INC CLASS C llegó a 174.31 después de un movimiento del 5,55% que ha durado 2 días.

Read more
July 23, 2024North_American_Stocks_esIC Markets

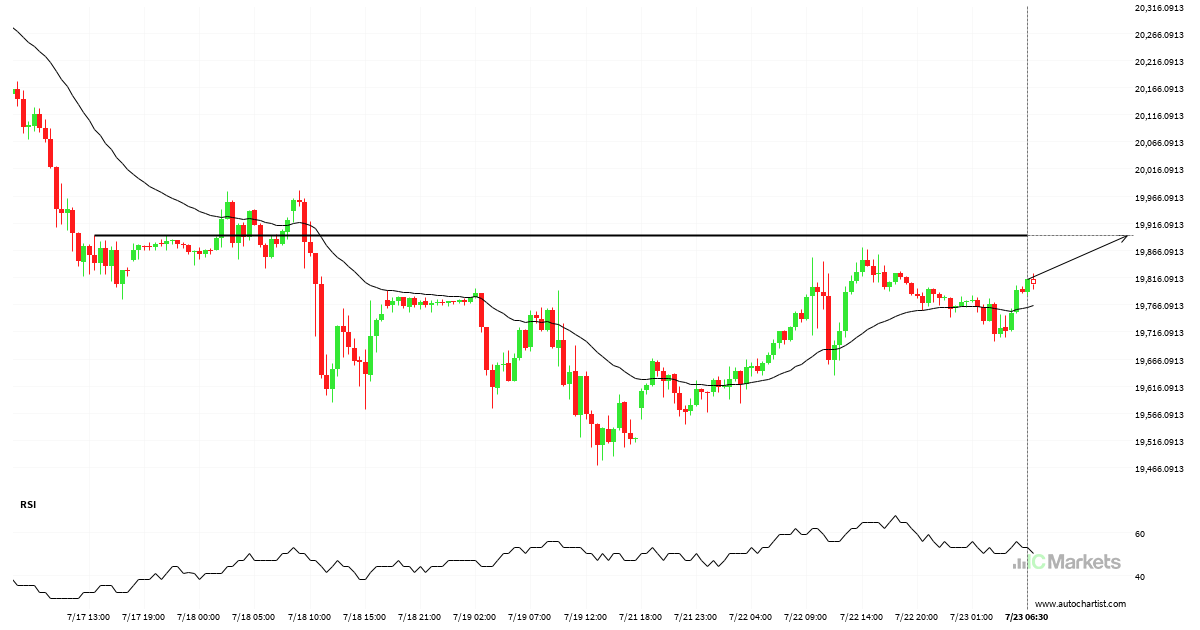
Un posible movimiento alcista en US Tech 100 Index

El US Tech 100 Index avanza hacia 19894.0391 y podría alcanzar este punto en un plazo de 20 horas. Ha probado esta línea previamente en numerosas ocasiones y esta vez no tiene porqué ser diferente, terminando con una recuperación en lugar de en una rotura. Si la rotura no ocurre, podríamos observar un retroceso de […]

Read more
July 19, 2024North_American_Stocks_esIC Markets

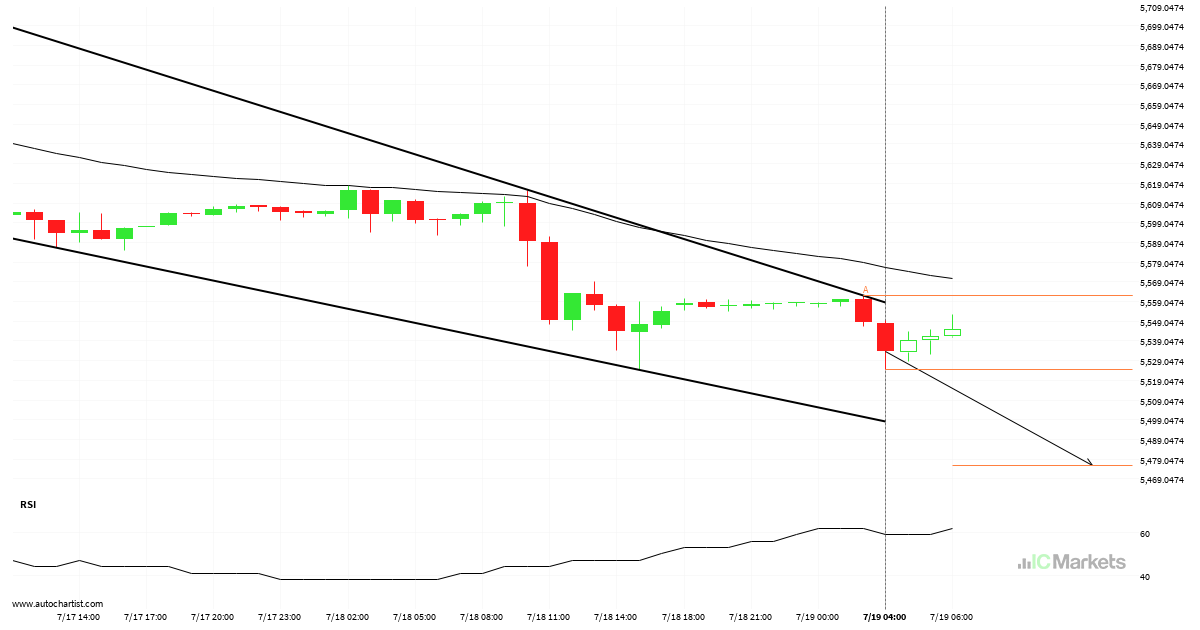
¿Tendrá el US SPX 500 Index suficiente impulso como para irrumpir el soporte?

Se ha detectado un patrón Cuña descendente en formación en US SPX 500 Index en el gráfico de 1 Hora. Existe la posibilidad de un movimiento hacia 5476.0014 en las próximas velas. Una vez que alcance resistance, el precio puede continuar su tendencia bearish o revertir a los niveles actuales de precio.

Read more
July 16, 2024North_American_Stocks_esIC Markets

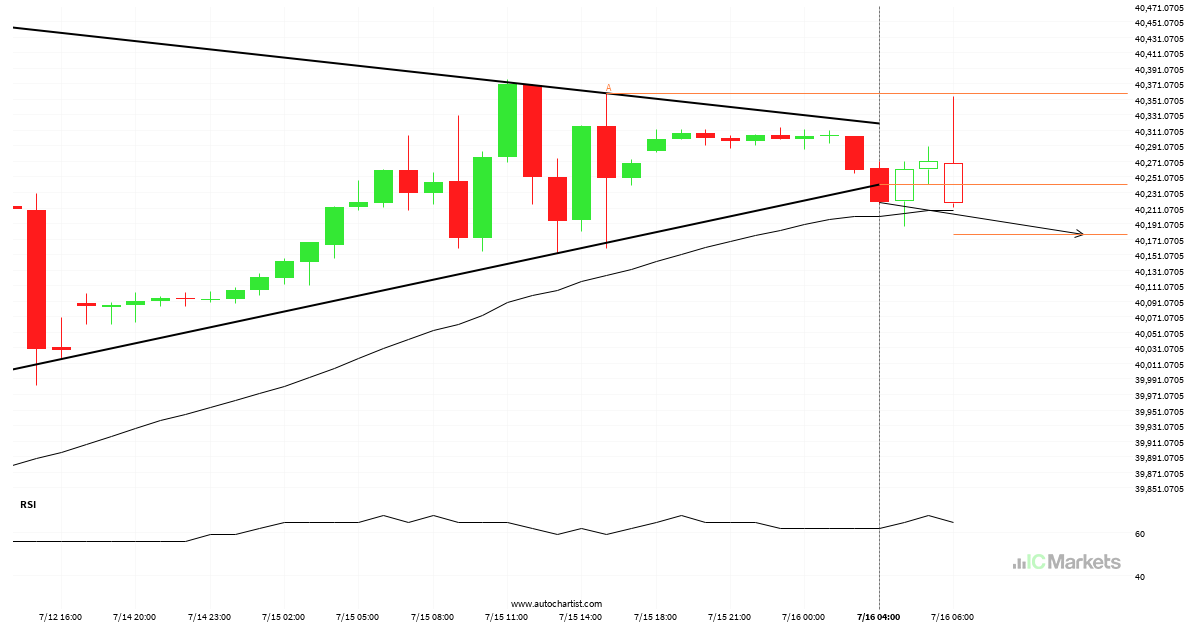
Previsión de trading de US Wall Street 30 Index a las 2024-07-16T09:00:00.000Z hasta las 2024-07-16T09:00:00.000Z

Las últimas 4 velas de 1 Hora en US Wall Street 30 Index formaron un patrón de Triángulo y rompieron a través de las líneas del patrón, lo que indica un posible movimiento bajista hacia el nivel de precio en 40176.3531.

Read more
July 15, 2024North_American_Stocks_esIC Markets

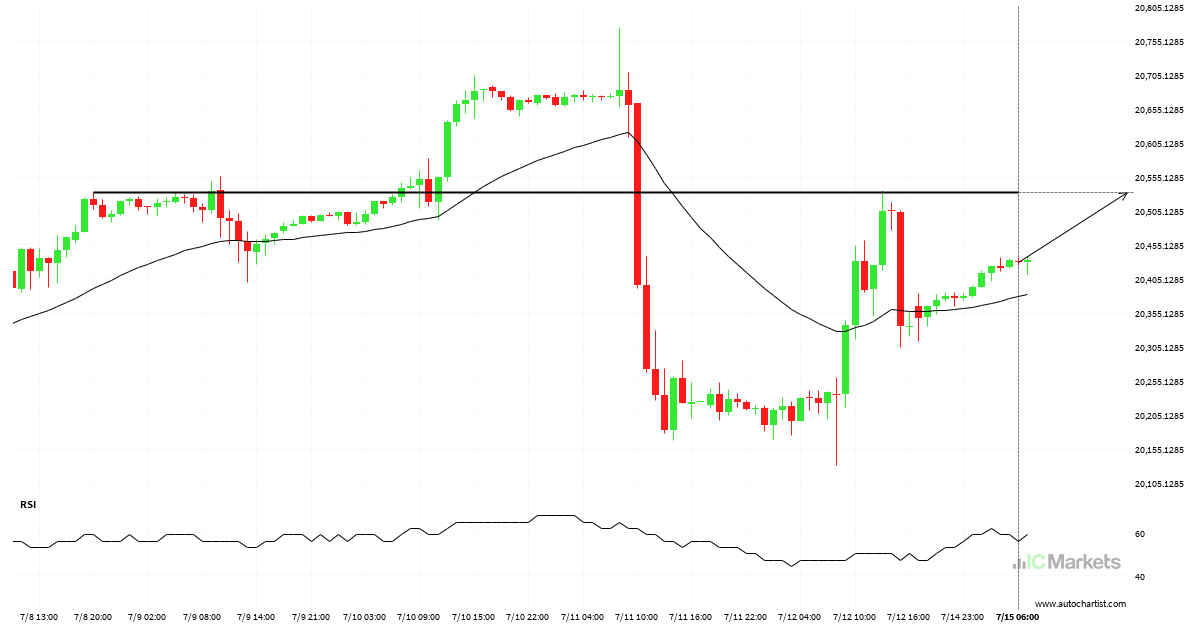
US Tech 100 Index acercándose a un importante nivel alcista clave

US Tech 100 Index se está acercando a una línea de resistencia en 20531.7500. Si llega a la línea de resistencia, puede atravesar este nivel para continuar con la tendencia alcista, o puede girarse y volver a los niveles actuales.

Read more
July 12, 2024North_American_Stocks_esIC Markets

¿Es probable que Netflix Inc. corrija después de este gran movimiento?

Netflix Inc. llegó a 650.48 después de un movimiento del 6,24% que ha durado 3 días.

Read more
July 11, 2024North_American_Stocks_esIC Markets

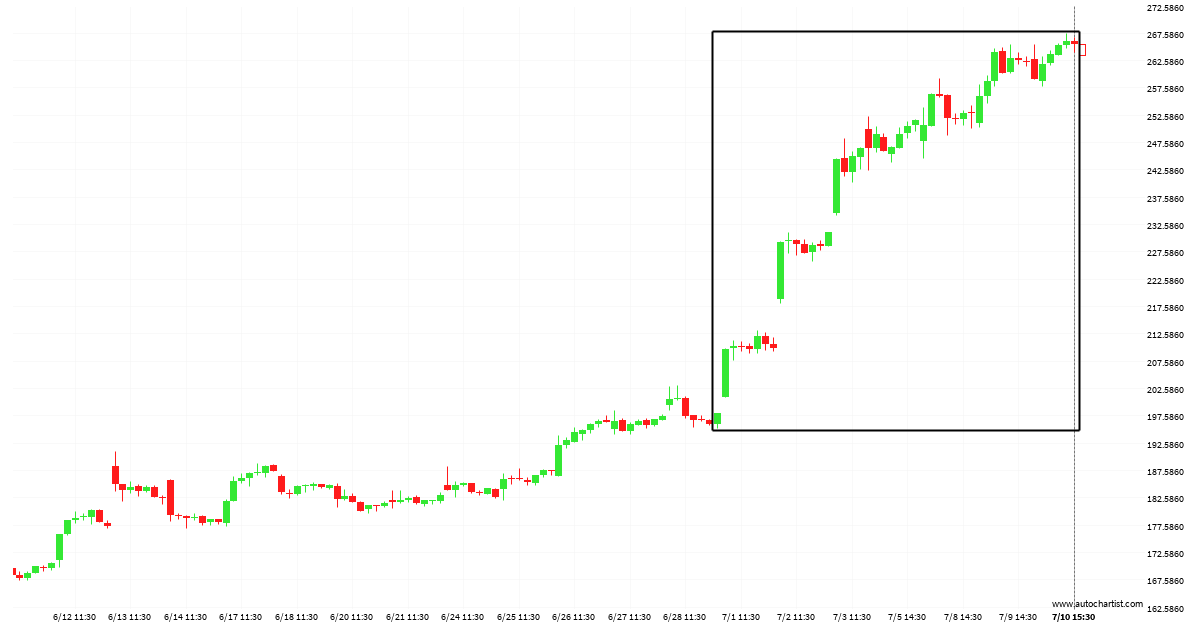
Tesla Inc. se ha movido upward durante los últimos 12 días

Tesla Inc. ha experimentado un movimiento alcista excepcionalmente grande de un 34,1% desde 197.99 hasta 265.505 en los últimos 13 días.

Read more
July 10, 2024North_American_Stocks_esIC Markets

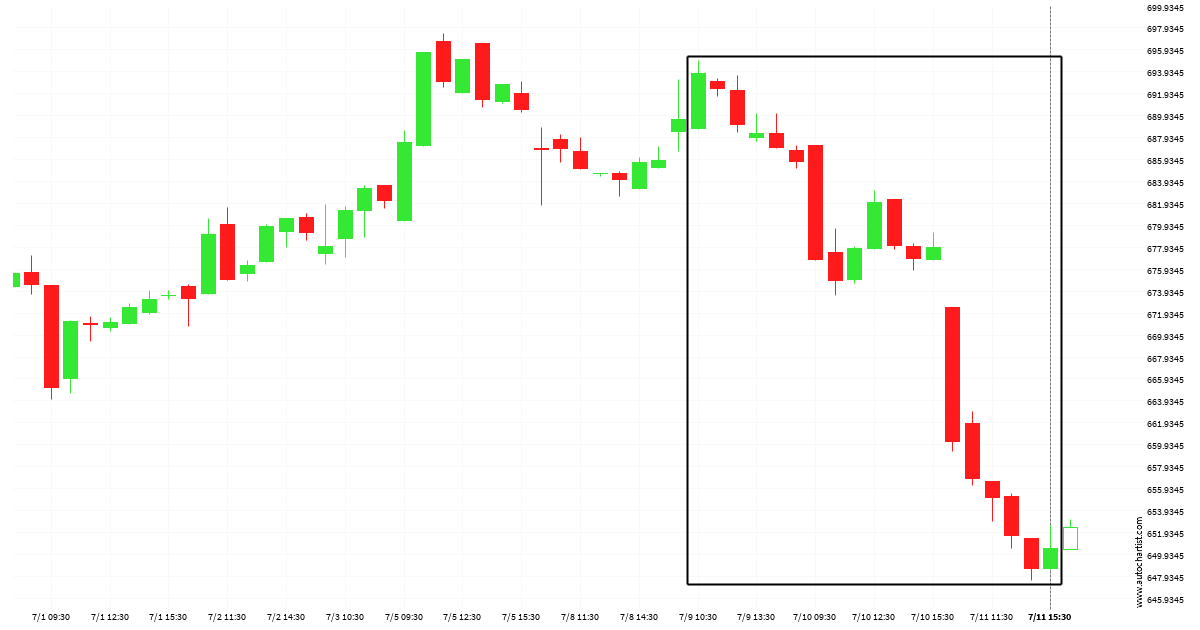
Gran movimiento en Tesla Inc., ¿se lo perdió?

Se ha producido un gran movimiento inesperado en el gráfico de 1 Hora de Tesla Inc. que comienza en 197.99 y finaliza en 262.585. ¿Es esto una señal de algo nuevo? ¿Qué podemos esperar en el futuro?

Read more
July 9, 2024North_American_Stocks_esIC Markets

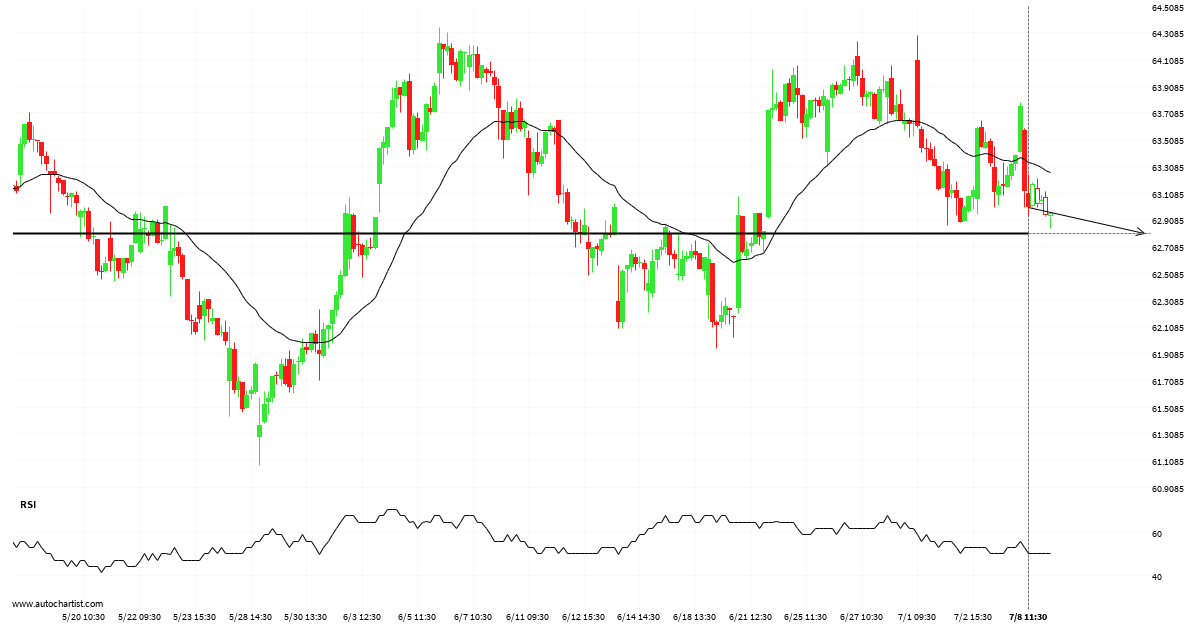
¿Deberíamos esperar una irrupción o una recuperación del Coca-Cola Co.?

El Coca-Cola Co. avanza hacia la línea de 62.8050, que ya ha probado en numerosas ocasiones durante el pasado. Hemos observado un retroceso desde esta posición en el pasado, por lo que en esta fase no está claro si atravesará este precio o se recuperará como ya hizo antes. Si el Coca-Cola Co. continúa con […]

Read more
July 8, 2024North_American_Stocks_esIC Markets

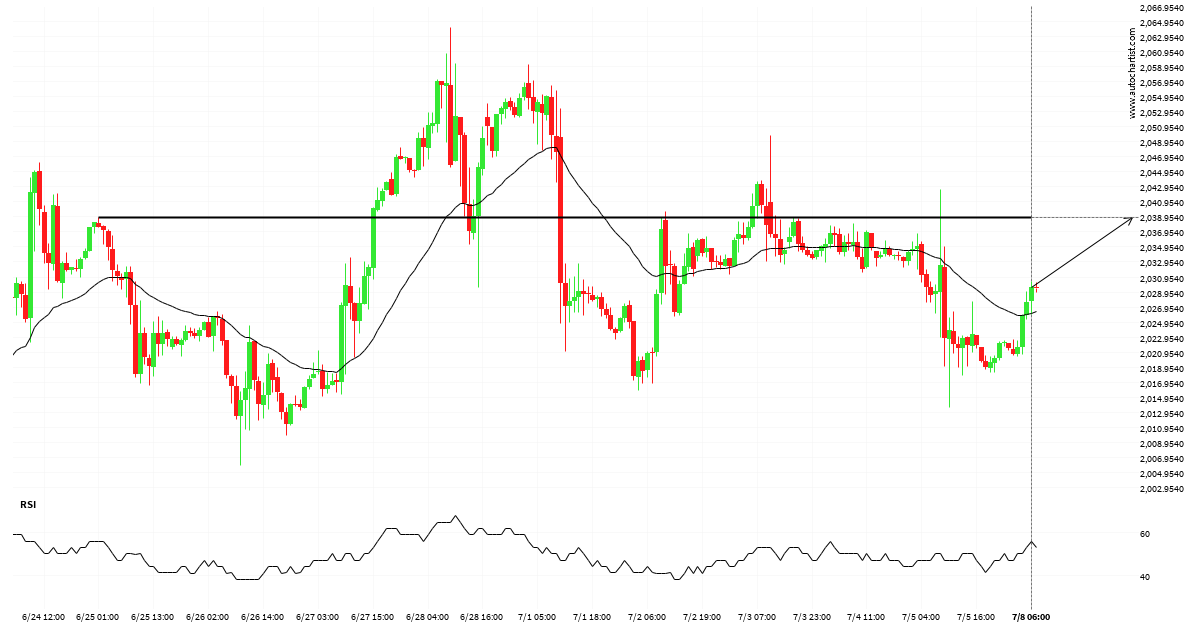
US Small Cap 2000 Index: plan para operación alcista a corto plazo hasta 2038.8500

US Small Cap 2000 Index se está moviendo hacia un nivel clave de resistencia en 2038.8500. Este es un nivel que US Small Cap 2000 Index ya testeó previamente. Esta podría ser una buena oportunidad para operar, ya sea al precio actual o después de superar este nivel.

Read more
  • 1
  • 2
  • 3
  • …
  • 9
  • 10
  • 11
  • 12
  • 13
  • 14
  • 15
  • …
  • 89
  • 90
  • 91

Recent Posts

  • UK 100 Index – المستوى الرئيسي – مقاومة
  • Gold vs US Dollar – نموذج الرسم البياني – قناة صاعدة
  • US Wall Street 30 Index – المستوى الرئيسي – مقاومة
  • Brent Oil vs US Dollar – نموذج الرسم البياني – قناة صاعدة
  • Brent Oil vs US Dollar – نموذج الرسم البياني – قناة صاعدة

Recent Comments

    Translation


     Edit Translation

    Trade with

    a market leader you can rely on

    Open Trading Account Try a Free Demo

    Forex Trading

    • Accounts Overview
    • Open an Account
    • Launch Web Trader

    Trading Specifications

    • Spreads and Commissions
    • Range of Market
    • Trading Hours
    • Funding
    • Withdrawal

    About IC Markets

    • Help Center
    • Why IC Markets
    • Regulation
    • Legal Documents
    • Contact Us


    Forex Trading

    • Accounts Overview
    • Open an Account
    • Launch Web Trader

    Trading Specifications

    • Spreads and Commissions
    • Range of Market
    • Trading Hours
    • Funding
    • Withdrawal

    About IC Markets

    • Chat with a Specialist 24/7
    • Why IC Markets
    • Regulation
    • Legal Documents
    • Contact Us

    Disclaimer: This material is marketing material where all marketing material is published for informational purposes only. This material does not contain and should not be considered as containing - investment advice and recommendations, or suggestions for performing any actions with financial instruments. The built-in widgets belong to their external independent authors, and IC Markets is not responsible for their content and their impact on trade.

    All content rights reserved. Opinions of the authors may not coincide with the opinion of the blog editors. When copying materials from this site or connecting to an RSS feed to republish our articles, a link to IC Markets or attribution in the format ‘IC Markets Blog’ is required. For general questions, please contact the editorial office via the form on the Contact us page.

    Risk Warning: Trading Derivatives carries a high level of risk to your capital and you should only trade with money you can afford to lose. Trading Derivatives may not be suitable for all investors, so please ensure that you fully understand the risks involved and seek independent advice if necessary. A Product Disclosure Statement (PDS) should be considered before entering into a transaction with us.

    The contents of this page are general information only and does not take into account your personal situation, financial objectives or needs. It is up to you to make sure the products that we offer suit your specific needs. You should not trade with us unless you understand the features and risks of the products that we offer. This means that you might need to seek independent advice before you start trading with us.

    © 2022 Raw Trading Ltd | All rights reserved.
    • Sample Page